False Idols of Metrics
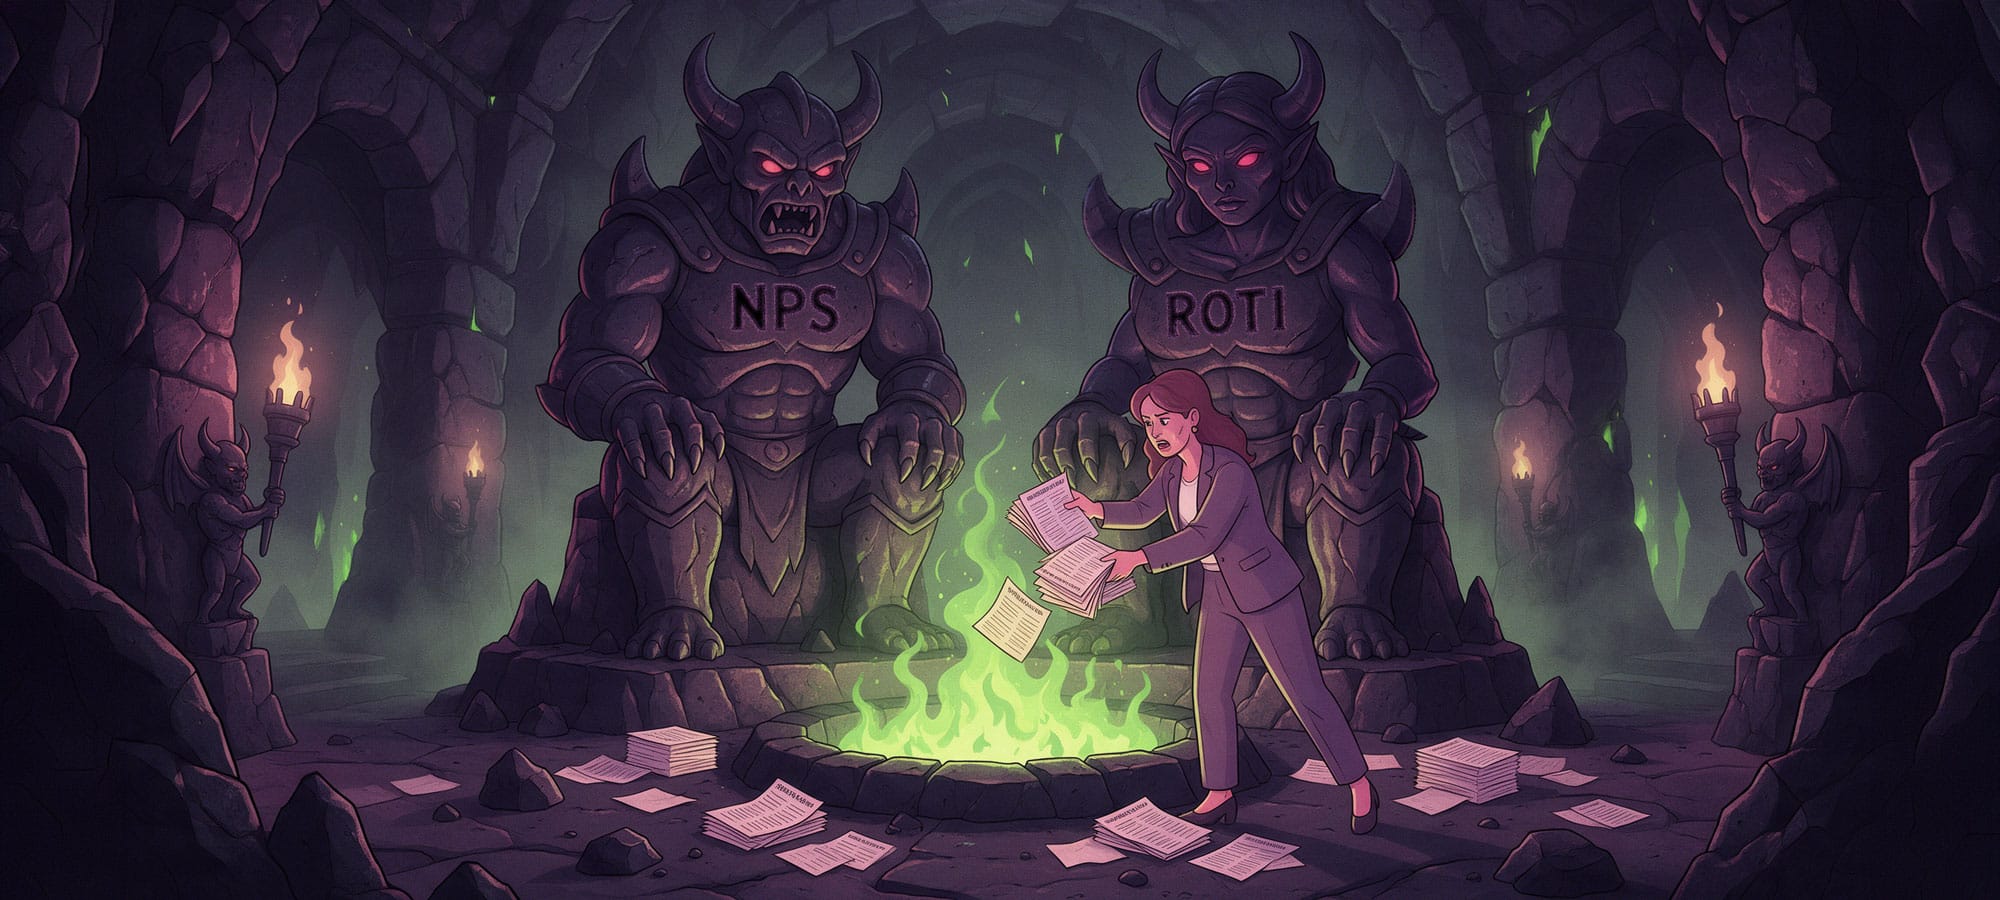
FALSE IDOLS OF METRICS Veronica L Perez and Catherine C M Kelley warn of the dangers of praying to NPS and ROTI to prove your learning works - and show that there is another path.
The year is 2022.
The work climate: tense.
The new hire: inquisitive.
It’s 2022, and government new hire Penny PM is onboarded to help lead a professional development L&D program that’s been running for a few years now. The team is running lean, and everyone is wearing multiple hats. But Penny has just one burning question as she learns the ropes - how do we know the program is doing what it claims it can do?
Join us as dynamic duo Penny PM and Opal Operations team up in this unexpected journey in the pursuit of better data.
Penny PM’s question was focused on the program’s claims - or rather - their intention. To create practitioners across 6 domains. Great. She could get on board with that. So what was the program reporting out on? They used two common L&D metrics:
Net Promoter Score (NPS) - a customer loyalty and satisfaction metric rated on a 10-point scale that measures how likely people are to recommend a company, product, or service to a friend or colleague.
Return on Time Invested (ROTI) - an internally created question rated on a 5-point Likert scale asking learners the extent to which they felt the class was worth the time invested in attending.
So, Penny asked herself: what are we doing with the NPS and ROTI in relation to trying to know if we’re creating practitioners?
The NPS here essentially measures the likelihood of recommending our classes to other federal colleagues. So, were our learners actually recommending our courses - such that we might reasonably claim our program was contributing to the creation of practitioners by grassroots efforts from our learners? As it turns out - not only did the program not have data to support this, but they didn’t have supporting mechanisms in place to support the “promotion” ability. Ability to rate a course? Nope. A “share” button to send the course to someone? Nope. Pre-canned language recommending the class after completion for the learner to send out? Also, nope.
Penny swiped a tiny bead of sweat. Not time to worry… yet. We still had our ROTI. Let’s look at that.
The ROTI was a variant of the Return on Investment. Rather than trying to quantify the tangibility of financial returns, they focused on a single criterion: time. The program basically asked the learners was this class worth your time? This question wasn’t actually a wholly insufficient piece of information. But – by understanding someone’s opinion on the worthwhile efforts of their time spent in a class - could we reasonably connect that to understanding if we are actually creating a practitioner? Penny couldn’t see it.
The status quo wasn't necessarily wrong. NPS and ROTI are common L&D metrics for a reason: they're easy to collect, easy to report, and useful for understanding the learner's experience. For many programs, they may be the best evidence available without a more comprehensive evaluation practice.
But they didn't answer the question Penny needed to answer.
NPS and ROTI capture self-reported learner satisfaction and perception. They tell us whether learners would recommend the experience or felt it was worth their time, but not whether they learned something, changed how they made decisions, or behaved differently on the job.
That was the gap. A “practitioner” meant they learned something well enough to apply it in their day job. Penny needed evidence of learning beyond the classroom, whether knowledge translated into changed decisions and behavior.
If satisfaction wasn't enough, what would be? What could Penny measure that would give her credible evidence that learning had actually translated into practice?
With no clear connection on how a customer loyalty metric or time-invested was indicative of a program’s ability to generate practitioners, Penny turned to what she knew best.
An emerging scholar working toward her PhD, Penny brought a rigor to the problem that the program desperately needed. She had been trained to question assumptions, follow the evidence, and look for methods that could withstand scrutiny. Her north star for solutions was oriented toward proven methods found through academically rigorous research and studies. So she set out to find something L&D had struggled to pin down: a way to credibly ‘prove’ learning transferred from the classroom and into applied practice.
What followed was a six-month descent into the world of program evaluation, spanning industry frameworks, academic research, and enough evaluation models to make anyone question their life choices. Penny read, compared, questioned, and kept digging, convinced that somewhere in the literature was the answer she needed.
Instead, the deeper she went, the less certain she became. The models fell apart under scrutinous testing. Some were never tested. The frameworks competed. The promise of a rigorous way to demonstrate learning transfer remained frustratingly out of reach.
Six months in, Penny was frazzled, empty-handed, and no closer to an answer. And her boss was still waiting.
Then, somewhere past page 26 of the search engine abyss, a tiny shimmer of intrigue glistened. Penny spent the next few weeks pouring through material from Dr. William Thalheimer. The material was passionate, anti-L&D-establishment, and seemed hell-bent on changing the status quo of program evaluation through more meaningful and purpose-driven surveys. Finally, something Penny could get behind!
Dr. Thalheimer promotes two distinct but interrelated concepts. First, his self-created Learning-Transfer Evaluation Model (LTEM) is “specifically designed to help organizations get feedback to build more effective learning interventions and validate learning results” (worklearning.com/ltem). Validate learning results really resonated with Penny. She pulled down a copy of his report, studied it, and ultimately thought this was something worth pursuing.
But how to get started?
Enter Opal Operations.
The silent powerhouse keeping the entire program afloat. With a soft-spoken voice and the ability to resolve team conflict with grace and ease, Opal nearly ran the entire Communications, Marketing and Data Analytics department as a team of one. With Opal’s extensive working knowledge of the historical context for the survey builds, the technical understanding of its capabilities, and the quiet force that moved rooms, she was the perfect partner in crime.
A few hallway conversations with Opal on her thoughts on getting the program to a better data place, and the game was set. A few more emails and internal briefings later - and the team welcomed Dr. Thalheimer for a private bootcamp on how to implement this model into their program design.
But he wasn’t done. He offered a 3-month ongoing series of workshops to complement the LTEM bootcamp with his performance-focused survey design - “a research-inspired approach to surveying learners, gathering meaningful data, and reporting results with clarity.” worklearning.com Performance-focused surveys shift away from traditional Likert-scale questions aligned to Kirkpatrick Level 1, such as “On a scale of 1–5, how satisfied were you?” and instead focus on providing response options with language centered on what learners know, can do, and can apply.
Penny recruited Opal and three other critical players for the 5-person survey redesign: the data scientist, the teacher, the wild card (a new hire performance specialist who found the workshop material invigorating and intriguing).
Now, we would be remiss if we didn’t pause here in the story to unpack and untangle the science from the non-science here. Remember, Penny’s passion was rooted in proven, evidence-backed work.
Dr. Thalheimer provides a general framework for survey design. But the survey itself is created fresh each time, for the respective reader picking up this framework. Why does this matter? Science, my dear. Remember, Penny is working through her PhD at this moment. One of the niche skills they’re teaching her - you guessed it- is survey design. She knows better than to do what she just did, or what Dr. Thalheimer is recommending: create a new survey instrument for each evaluation rather than rely on a standardized measure. It can introduce challenges around consistency, validity, and comparability.
But she also knows something else: optimal conditions are rare. The perfect evaluation design isn’t always possible. Sometimes you have to work with what you have, test the limits, and learn from what happens. And that’s exactly what Penny decided to do.
When a survey (called a data collection instrument in scientific language) is built to the standards for academic research, there is a specific survey design process to make two things happen: 1) The survey measures what it is actually trying to measure, and 2) if you run it again in similar conditions, you get similar results.
Dr. Thalheimer doesn’t have a survey published that you can copy and apply. He’s got an ideology that he walks you through in his book on how to build your own. Which means, hypothetically speaking, it should get you pretty close to measuring what you’re after. And if you printed your survey to hand out copies at the Learning Reject Conference, others should be able to implement it in their organization and trust the results about as well as you do. It should.
What Penny & Opal gambled on.
A faux-longitudinal survey measuring a learner’s growth in knowledge, readiness, and motivation to apply learning based on behavioral response options rather than satisfaction ratings.
Why does that matter? Because if the program’s goal is to build practitioners, Penny needs to measure more than whether learners enjoyed the experience. She needs evidence of the changes that should lead to practice. Penny found these three factors showed up consistently in academic research as evidence of transfer.
The survey can't prove that someone will change their behavior on the job. But it can establish a stronger line of sight between the learning experience and the program's intended outcome, giving the program a way to get closer to demonstrating that it is building practitioners.
What made it faux?
The program (rightfully so) upheld its promise to its learning community for anonymity – so learner names & emails were not captured. This meant we couldn’t truly monitor unique individuals over time. Also, the program was voluntary. This meant we could not exclude participants – meaning, a true control and sample group was not possible.
The program worked with Dr. Thalheimer on a survey for their post-class evaluation of their intermediate classes. Then expanded the survey design, asking a nearly identical set of questions pre- and post-class for their entry-level and intermediate classes.
A sample idea of what a series of questions & responses looked like:
Pre-class (entry-level AI class):
How familiar are you with the concepts of AI?
- not at all familiar
Post-class (entry-level AI class):
How familiar are you now with the concepts of AI?
- somewhat familiar
Pre-class (intermediate-level AI class):
How able are you to apply AI concepts in your work?
- I think I might know how to apply.
Post-class (intermediate-level AI class):
How able are you now to apply AI concepts in your work?
- I know some ways I might apply.
So, does this survey idea work? Let’s find out.
Fast forward about a year and a few months later. Enter another new hire - Ana Analytics. Another brilliant mind to enter the team. Ana’s passion is letting the data tell the story. As she’s settling in and ramping up, we offer her an assignment. With no prior knowledge of Dr. Thalheimer’s work, she is a prime candidate. Neutral. Unbiased. Eager to explore. We ask her if she’s interested in doing some exploratory data analysis on our survey design we’ve been piloting for about a year now.
Ana handled our request for analysis as if we were a consulting job. She led a meeting asking us what type of questions we were trying to answer for our program (not what type of questions do you want this data to answer – she didn’t force us to map our wants to data availability). And then she said, let me explore the data and see what’s in the art of the possible.
Our response: Is our program capable of knowing, with any degree of certainty, whether our learners are actually applying (or trying to apply) the concepts we’re teaching them? And is it possible for us to report out anything resembling sentiment: There is a weak/strong likelihood the Program is contributing to “this” organizational impact by creating conditions for application of skills, practices and behaviors for % of learners completing “these” courses.
She came back some time later to give us updates on what she was or was not able to untangle in the data. She reminded us what we were asking for, as a program, and re-prompted for additional clarity, priority, and nuance. She left again.
Three months of investigative and exploratory data analysis later, she came back with one key finding. From our faux-longitudinal data design:
While the survey design was able to derive a learner growth metric, the fundamental design principle of not using a Likert design did not allow the survey to scale without considerable consequence.
Let’s reflect. About 6 months into the job (and during research for a new evaluation model), the program came out of pilot mode with a population of about 300. It was in mid 2024 when the LTEM and survey workshops happened, releasing in 2025. Reach is now about 700. Ana Analytics starts and provides her results in mid 2026. Reach is now about 1000. At the time of this report, it’s Q4 of 2026, and reach is now about 1300. Our total government organization is about 6000. Remember, it’s a voluntary program. But word of mouth is growing, and the trajectory tells us we’re scaling- and scaling fast. A non-scalable solution is devastating news.
But for Penny and Opal, not all hope is lost. Here’s what exactly made it unscalable. And here’s the plan to fix it. Our hope - to create a viable survey design that other organizations can replicate with faster, smaller loops to get to working solutions quicker than we did.
Here is a sample directly from Thalheimer’s material. https://www.worklearning.com/wp-content/uploads/2017/10/Thalheimer-PFSS-VOV-Handouts-169.pdf
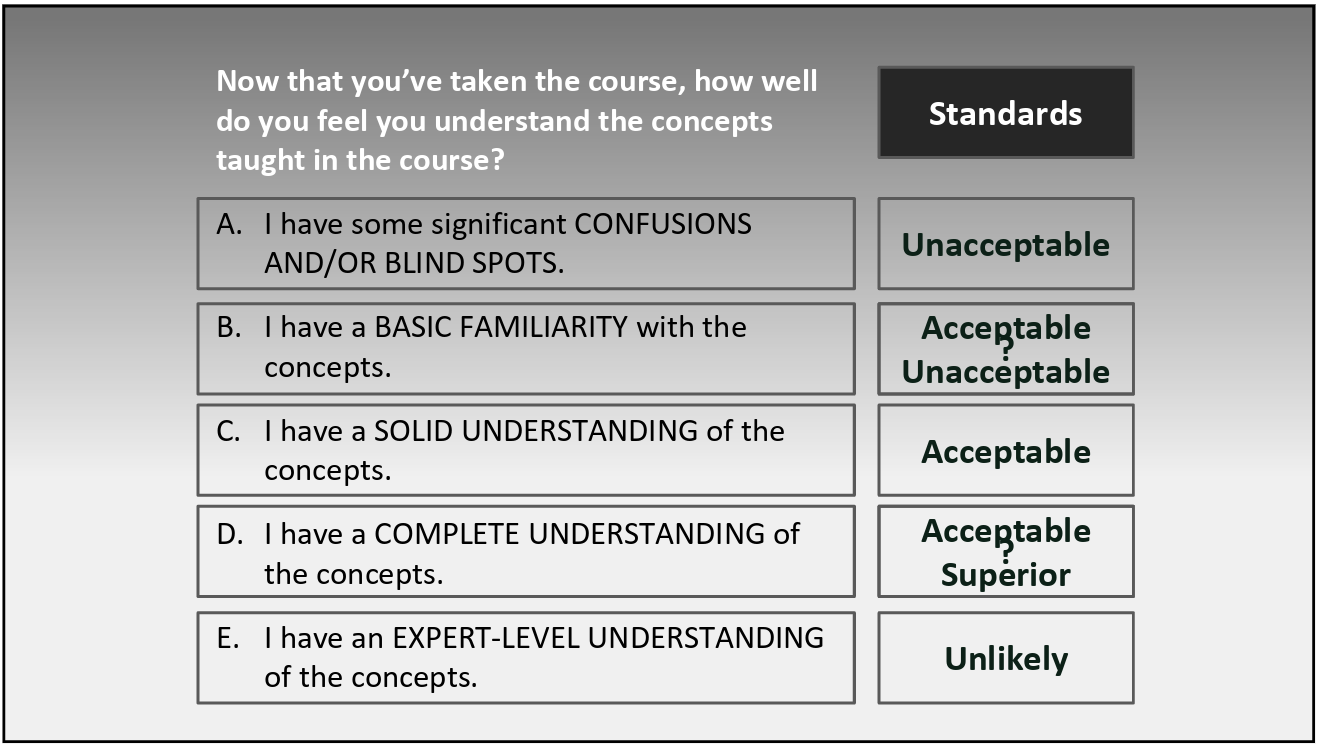
Now, this image is slightly misleading. The standards listed on the right are essentially a scaled-value response-choice survey design similar to a Likert survey, where Unacceptable =1 and Unlikely (but read the response “expert level understanding”) is therefore = 5.
First, Thalheimer teaches us that you can have more than one response mapped to a single standard. For example, you can add I have a rudimentary understanding of the concepts and map that as Unacceptable. This leads to 2 responses mapping to 1 Unacceptable standard.
This is how Dr. Thalhiemer coached our team. This is how we built our survey. Ana Analytics re-explained it like this -
We 1) inconsistently mapped many-to-one response options. Not every question has the same number of options mapped to Unacceptable, Acceptable, and so on.
Also, 2) we under-represented the second value - the one that captured that they learned some, but below our desired threshold. In some questions, we didn’t even have it represented at all.
Taken together, and add the anonymous submission factor, and now it’s extremely difficult to perform traditional, and even basic, quantitative data analysis. And we need that capability in order to predict the likelihood of creating conditions for learning to transfer into applied practice.
So, Penny and Opal, clink their glasses as they both commiserate to their lessons learned and give cheers to what’s next.
The program is currently solving these two issues through a single decision point: create hard rules to bring more consistency in the response mapping. For example: All questions will have exactly 1 Unacceptable, 2 Underperforming, 2 Acceptable, and 1 Not Applicable response options. They’re also working on implementing a few minor improvements that Ana recommended.
They’re also working on the best solution to have non-anonymized data on the backend without explicitly asking for names & emails from the survey respondents.
Taken as a whole, Penny and Opal would offer the following insights for L&D…
For instructional designers, curriculum creators, and training developers: using both the LTEM and performance-focused survey as an end-to-end experiential design blueprint can inherently lead to individual training courses that should be more likely to result in applied practice.
For program managers and other such training operation leads: as a program-layer document – LTEM can inform decision-making for an entire program intentionally designed around enabling learning transfer. When paired with robust survey design, it should be possible to get credible or useful insights. With a caveat that you really need someone with the niche skill of survey design. And a damn good data analyst.
Our new survey design won’t be built in a day. And even though we’ve gotten closer to answering our learning transfer question, we still have a long way to go.
- Veronica is a Product Manager with over 10 years of focus on delivering customer-centric products and services. She currently oversees the product execution of a federal continuous learning program. In her spare time, Veronica is working on her PhD in Organizational Leadership with a focus on education and learning program evaluation.
- Caroline is a learning strategy and operations professional focused on creating programs that center the learner perspective and drive organizational impact. She currently leads initiatives to innovate, measure, and optimize learning experiences.


Member discussion